While logged in to your Admin Account navigate over to platform.qooper.io and scroll on the left hand side of the screen and click "Reporting".
Scroll to the middle of the page until you find the Skill Gaps section.
The skills on this graph are populated from data collected from your participant's answers to the "Skills and Competencies" question of the Profile Form.
The skills in the answer to this question can be customized to your organization's needs by editing the answers to the Skills and Competencies question in the profile form.
To read more about how to edit questions in the profile please see this article.

The numbers on the chart reflect the number of mentors who said that they have a particular skill and the number of mentees looking to increase that skill for themselves.
Green - Mentee's who answered that they are looking to improve upon this skill.
Gray - Mentor's who answered that they have this skill.
To only view Mentee's responses click "Mentor" on the top of the screen to deselect it. This will show only mentee's responses of skills they are seeking. Vice versa clicking on "Mentee" will deselect it and only show you mentor's who have that skill.
The Skill Gaps graph is crucial because it helps you as the program administrator identify areas of opportunity within your organization based on your participant's needs versus your mentor's strengths.
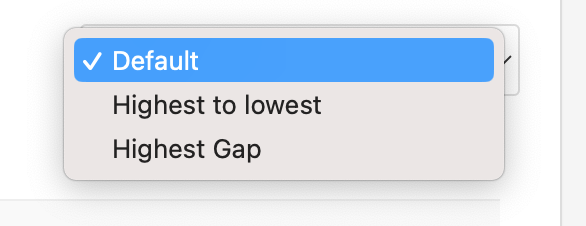
Furthermore, you can filter the graph in three different views. You cab select the default view, from highest to lowest occurrence of that skill, or by highest gap between mentor and mentee's who have and desire that skill.