-
Accessing Learnings Graph:
- Visit platform.qooper.io.
- Log in to your admin dashboard.
- Navigate to the "Reporting" section.
-
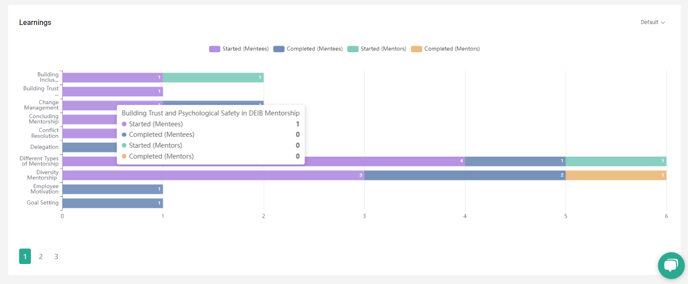
Understanding the Graph:
- The Learnings graph showcases the number of participants who started and completed their learning activities within your program.
- The Learnings graph showcases the number of participants who started and completed their learning activities within your program.
-
Key Insights:
- Easily track participant engagement and progress in learning modules.
- Gauge the success of your learning initiatives by observing completion rates.
English